

Photo by Francesco Liotti on Unsplash
Write a Babel plugin to inject profiling code
A plugin to dynamically wrap React components with Profiler during building without touching your code


A long time ago 😅 I wrote the first post Understand Babel Plugin to go through the core concept of how Babel transforms your JavaScript source code, you can go back to read it if you have not, it's essential to this second one, which we will write a practical plugin to do something more useful.
The Motivation
In React apps, it's common to trigger unnecessary re-rendering which is the main source of performance issues. Reflecting on the UI, the user will experience laggy navigation, scroll or tab switch, making it feel a "janky" experience. So it is useful to understand where the re-rendering happens and how much time it costs, so we can optimize effectively to avoid those expensive renderings.
There are different ways to measure, one of which is Profiler provided by React, which could help measure rendering performance programmatically. You just wrap any component to be measured under <Profiler>.
Its usage is straightforward:
<Profiler id="MyComp" onRender={callback}>
  <MyComp {...props} />
</Profiler>
onRender callback will be invoked with the following parameters:
  id, // identify a compoennt in the result when you measure multiple comps
  phase, // either "mount" (if component just mounted in the tree) or "update" (if it re-rendered)
  actualDuration, // time spent rendering the committed update, this is what we mostly care
  baseDuration, // estimated time to render the entire subtree without memoization
  startTime, // when React began rendering this update
  commitTime, // when React committed this update
  interactions // the Set of interactions belonging to this update
The Sample App
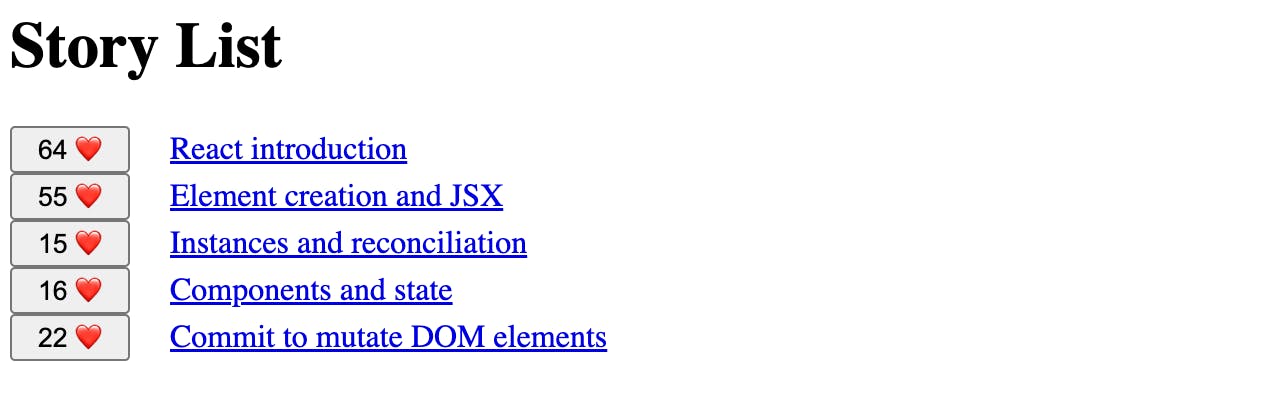
To demonstrate, we need a small sample App to be profiled. Here we use a typical list page, a story list which renders a bunch of story items. And some interaction where a user can like each story item to increment the liked number (every UI dev should write it in 10 mins right?). So the App is pretty straightforward:
App renders
<Header />and<StoryList />StoryList renders a list of
<StoryItem />Each
<StoryItem />renders a story title and "like" button with current liked count.
Click the button increases the liked count for this story
The hierarchy looks like this:
<App />
  <Header />
  <StoryList />
    <StoryItem />
It will display something like below:
Now we have the App, we could simply wrap each component with Profiler and attach onRender callback:
export default function App() {
  return (
    <Profiler id="Header" onRender={(id, phase, actualTime) => {
  console.log(`component ${id}: ${phase} took ${actualTime}`)
   }}>
      <Header />
    </Profiler>

    <Profiler id="StoryList" onRender={(id, phase, actualTime) => {
      ...
    }}>
      <StoryList />
    </Profiler>
  )
}

// inside StoryList could also wrap item component
<Profiler id="StoryItem" onRender={(id, phase, actualTime) => {
  ...
}}>
  <StoryItem />
</Profiler>
This has some limitations:
It's tedious to wrap every component and break the original hierarchy
In
onRendercallback, we cannot do too much except print out plain metrics
In real apps, it is usually composed of many components. There will be tons of logs across your App hierarchy during a certain interaction. It's not very helpful in terms of finding real performance issues.
It would be more useful to aggregate the metrics collected from each component: we could sum up the number of renders by each component and calculate the total/average rendering time during a certain interaction, and print out these aggregated data per component in a readable way. So we could identify if there is excessive rendering happening, and if rendering is expensive.
React HoC to Apply Profiler
React HoC (high order component) is useful to 'enhance' each component: it takes the original functional component, wrap it in Profiler. Its usage is like this:
// inside StoryList, export the 'enhanced' StoryList wrapped in Profiler
export const StoryList = withProfiler('StoryList', () => {
  // original component
})

// inside StoryItem, export StoryItem wrapped in Profiler
export const StoryItem =  withProfiler('StoryItem', (story, onToggle) => {
  // original component
})
It provides some advantages:
No need to change the overall App hierarchy
The wrapping happens inside each component to be measured. From outside, it still looks the same as the original composition.Centralize
onRenderimplementation
withProfilerprovides a singleonRendercontroller to store metrics (a simple map keyed by component id) every time arenderis triggered, and do all calculations before printing out.Easily write Babel plugin to inject this HoC
withProfilerautomatically
This is the main thing we talk about in the rest of the post.
How to implement this HoC is not the main focus of this post, you can refer to the code repo for more detail. The signature looks like this:
export default function withProfiler(id, Comp) {
  return (props) => (
    <Profiler id={id} onRender={(compId, phase, actualTime) => {
      // single controller to centralise the time metrics
      ConsoleProfiler.record(compId, phase, actualTime)
    }}>
      <Comp {...props} />
    </Profiler>
  )
}
Babel Plugin to Inject HOC
Now we have the HoC to facilitate applying Profiler to each component, the next task is to write a plugin to inject this HoC without the need to touch any component file, how exciting!
Essentially we need Babel to do two things:
Add
import withProfilerstatement
This is already discussed in the first postReplace original
functionto be wrapped inwithProfilerThis is something new we need to tackle.
If we take StoryItem as an example, we want to transform every component file with this signature export const Comp = () => {..} to the code below: the source code would be the same in your editor, just what's running in the browser is magically upadted.
// this is what's running in the browser after the build
import withProfiler from './withProfiler';

// then replace original function to be like this:
export const StoryItem = withProfiler('StoryItem', ({ story, onToggle }) => {

})
Back to the AST visualizer to help us understand tree structure and how we apply AST transformation.

From AST, we can see what we need is to create a new CallExpression node and wrap the original ArrowFunctionExpression node to get what we want.
The key part is to use babel/template. It's a useful tool to let us write some string representation and it helps rebuild the complex AST. Exactly what we need here.
The code is not too long, but takes some time to digest. I highlight the key lines with comments.
// with-profiler-plugin.js
const t = require('@babel/types')
const template = require('@babel/template')

const pluginFn = ({ types: tt }) => {
  return {
    visitor: {
      Program(path, state) {
        // insert import
        const idf = t.identifier('withProfiler')
        const importSpec = t.importSpecifier(idf, idf)
        const importDeclaration = t.importDeclaration([importSpec], t.stringLiteral('./withProfiler'))

        path.unshiftContainer("body", importDeclaration);
      },

      ExportNamedDeclaration(path, state) {
        const filename = state.file.opts.filename
        try {
          console.log('## ExportNamedDeclare.visit', filename);
          const def = path.get('declaration.declarations.0')

          const compName = def.node.id.name
          const origArrowFn = def.node.init
          // use template to transform a string to equivalent AST node CallExpression
          const wrappedFn = buildFunctionWrapper({
            ORIGINAL_FN_CALL: origArrowFn,
            COMP_NAME: `'${compName}'`,
          })
          // replace the original node with the new
          path.get('declaration.declarations.0.init').replaceWith(wrappedFn)
        } catch (e) {
          console.log(`## ExportNamedDeclare.visit fail ${filename}`, e.message);
        }
      },
    }
  }
}

const buildFunctionWrapper = template.default(`{
  withProfiler(COMP_NAME, ORIGINAL_FN_CALL)
}`);

module.exports = pluginFn
In order for the plugin to take effect, remember to config it in the .babelrc.
// suppose the plugin file is put in project root
{
  "plugins": ["./with-profiler-plugin.js"]
}
Now start the sample app, you will see the magic happening:

Every time we click 'Like' button, you will see a nice table printed out to summarise the number of renders and accumulated time.
That's all for this real plugin journey! I found it quite useful when sometimes we cannot use the React dev tool via Chrome UI to debug. In fact, this is the solution I built up to help find the root cause of slow screen transition in a real React Native app.
Potentially we could integrate it into pipeline and collect profiling metrics in the real app. It does involve some overhead, and require special production build with profiling enabled.
References
https://addyosmani.com/blog/profiling-react-js
https://www.debugbear.com/blog/measuring-react-app-performance
https://gist.github.com/bvaughn/60a883af01716a03a1b3285a1029be0c
writing-a-custom-babel-plugin-using-learnings-from-react
Code Repo with plugin and sample app:
https://github.com/6thfdwp/with-custom-babel-plugin